On Forecasting Inflation
What do the median CPI index and older consumers have in common? They are bad at forecasting inflation!
Note: any and all opinions are entirely my own and do not necessarily reflect those of the Cleveland Fed, the FOMC, or any other person or entity within the Federal Reserve System. I am speaking exclusively for myself in this post (as well as in all other posts, comments, and other related materials). No content whatsoever should be seen to represent the views of the Federal Reserve System.
I made my meme debut on Twitter last weekend with a meme in support of trimmed-mean inflation indices, trimmed mean PCE particular:
As it made the rounds, some discussion of whether median or trimmed mean inflation had better predictive power for where headline inflation would be in the future (h/t @AlecStapp). So: which measure is best for predicting future inflation? And how do consumers do?
This post will show that trimmed mean and core inflation measures are notably better at forecasting headline inflation than median indices or even headline inflation itself. Further, while consumer surveys have much to offer, consumers have a bad track record at forecasting future inflation—but there’s an interesting nuance to this!
Who Cares?
Going through the differences between different indices is admittedly for nerds. But it’s important.
That there’s been a lot of talk about inflation over the last year goes without saying. The primary focus of this debate has been the nature of the current inflation spike: is it base effects? A one time increase in the price level? A new trend?
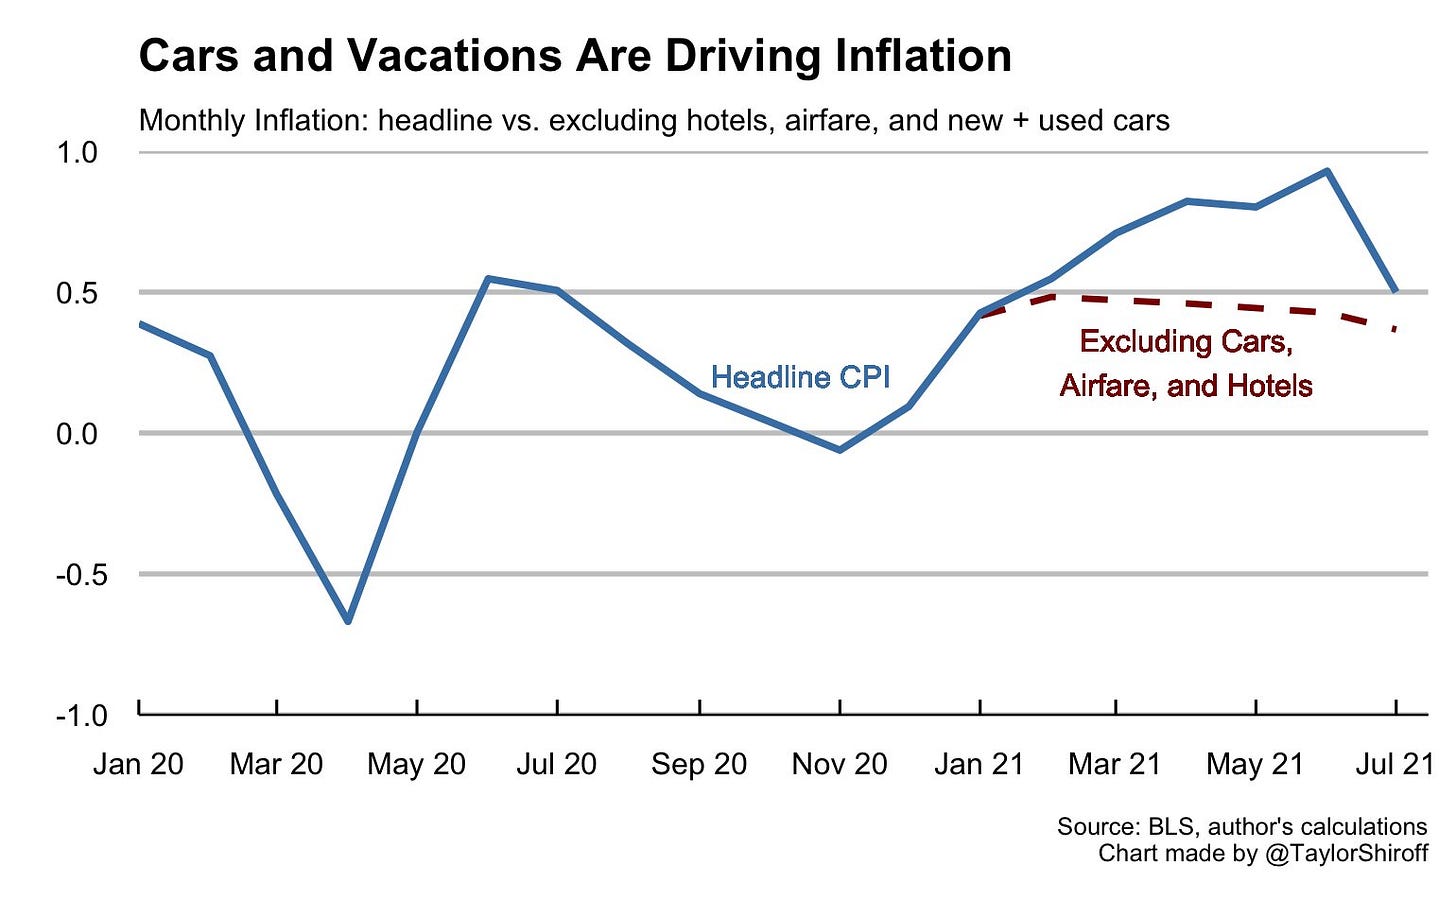
Much of the commentary from those who suggest recent inflation is transitory has focused on the dramatic reduction in headline inflation when one removes a couple of pandemic-related components. For example, I’ve included this chart a few times on here:
The point is that looking at the headline number isn’t always that helpful, especially when weird things like the pandemic are distorting inflation readings higher or lower than would truly be representative. For example, as seen above, monthly headline inflation was about 0.9% in June 2021, but only 0.45% if you exclude car, airfare, and hotel prices.
Core inflation recognizes that certain components—namely, food and energy—are more volatile than others, and therefore it might be useful to have a measure of inflation that excludes them. But so many other components are equally volatile--why not just take out the extreme prices changes, up and down, as a whole? This is what trimmed inflation measures do. The point is to get an inflation measure that’s more of a measure of central tendency among all components.
Similarly, median price indices take the median price change from their respective base index and use that as their metric.
Headline inflation numbers matter in the long run and still receive the most attention from the government, media, and private sector. But in the moment, at t=0, the interesting thing is that headline inflation numbers aren’t as good at forecasting future headline inflation as trimmed mean and core indices are. This makes sense, as trimmed mean and core indices sift out more volatile components of each index. It’s good to think about which measure among these holds the most predictive power for headline inflation so we know what numbers we should care about the most.
Measuring Accuracy
Which index gives the best measure for future headline inflation? Which inflation measure--headline, core, trimmed mean, or median--one should look at in order to guess where inflation will be in 6, 12, 18, and 24 months? In slightly more econometrics-y language, which measure at t=0 minimizes forecast errors at horizons of 6, 12, 18, and 24 months?
First, let’s take a look at what the data looks like. I am doing this twice over for PCE and CPI, as even though PCE inflation is the superior measure, CPI inflation gets more attention. Since August PCE data won’t come out until next month (!), I won’t include August’s CPI data in any of the following analysis. First, PCE:
Below, the CPI and its variants:
One thing is clear--trimmed mean and median measures do a much better job seeing through transitory price changes. This doesn’t mean these measures are flat by default, as I think some critics might believe. I excluded 1977-1984 from the graph as I do not have data on the median indices for that period, but the trimmed mean measures moved significantly upward during the tail end of the Great Inflation.
I will measure accuracy using both mean absolute forecast error, which takes the average across the absolute values of each error term, and the mean squared forecast error, which squares each forecast term and then takes the average. The lowest score by each metric wins.
This Is Boring, Please Get To The Results
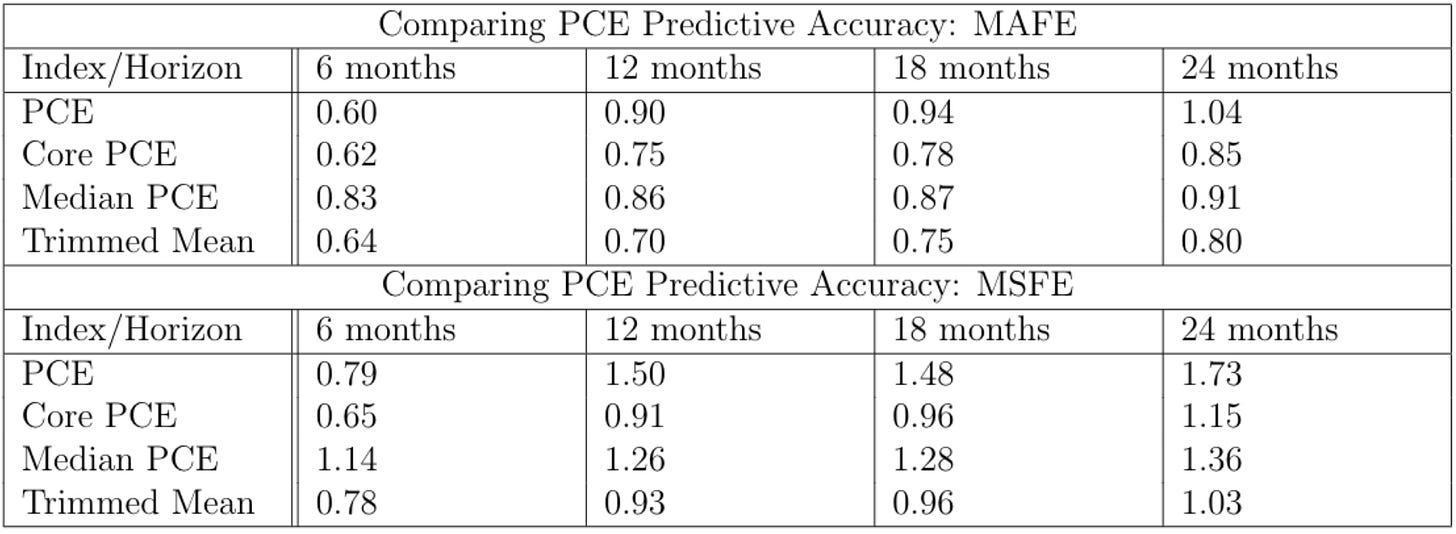
I’ll start with PCE inflation. Below, I’ve put into a table how each measure does as a standalone forecast for headline inflation 6, 12, 18, and 24 months into the future. This first sample is the entire sample, from January 1984 through July 2021. The index with the smallest number at each time interval is best.
Looking at the mean absolute forecast errors (MAFE), headline inflation is only the best forecast for future headline inflation at the 6 month interval. This is mostly due to transitory effects—inflation today is similar to inflation yesterday and tomorrow, but not necessarily in a year; a form of autocorrelation. At every subsequent interval, however, trimmed-mean inflation beats the rest.
Mean squared forecast errors (MSFE) punish larger errors more than smaller errors, since they square each error term. By this measure, core inflation actually beats the others at the 6 month interval and is just about as accurate as trimmed mean PCE.
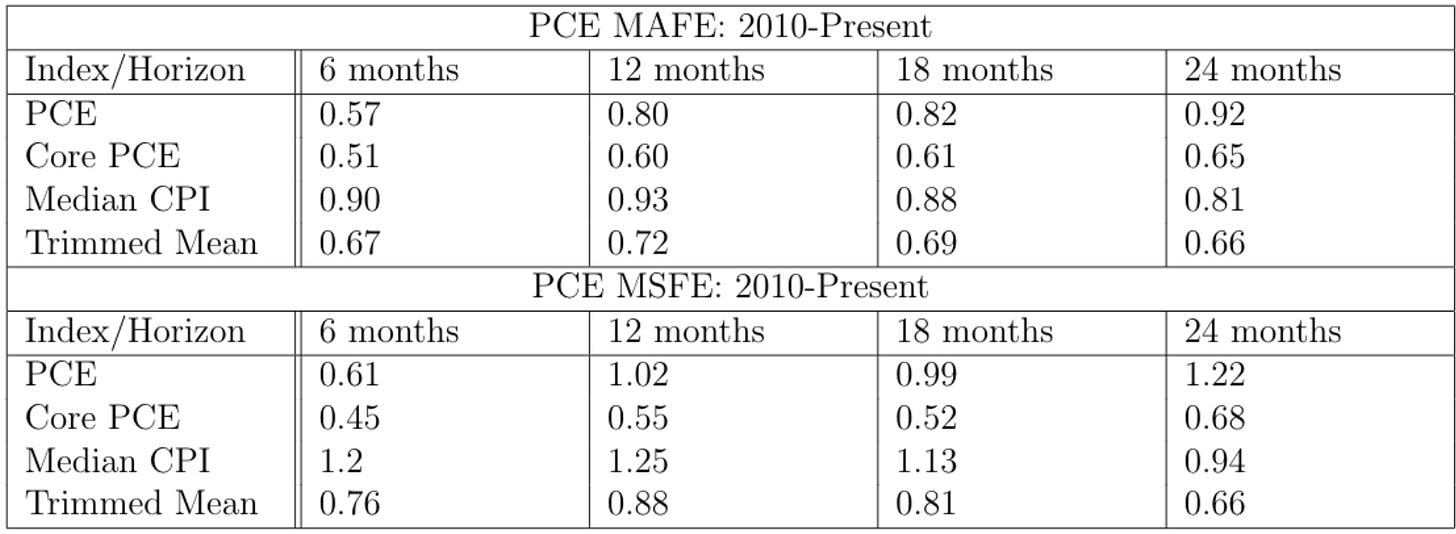
These results change a bit when we consider the period of 2010 to the present. But regardless, trimmed mean and core PCE wind up being a better forecast for headline PCE the further out the forecasting horizon is.
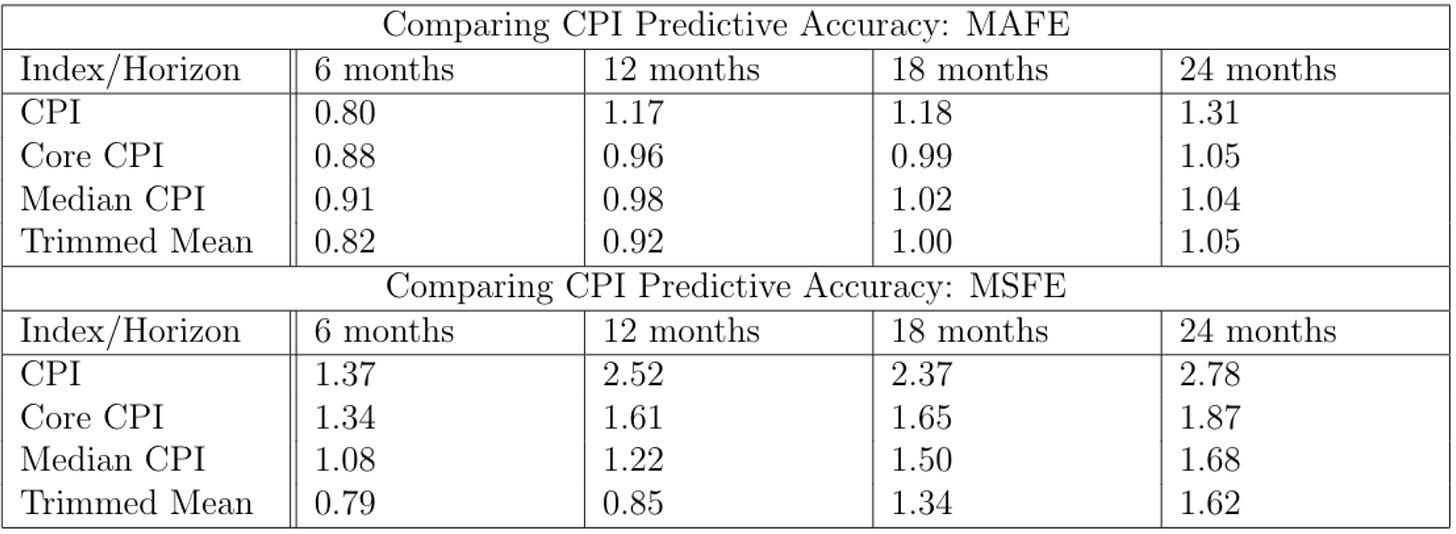
The results are very similar for the CPI and its variants. By MAFE, core CPI and trimmed mean are almost tied in quality, but by MSFE, trimmed-mean CPI beats all other measures at every interval.
In the sample from 2010 to the present, core CPI tends to be the best forecast.
Larry Summers, in a tweet seemingly designed to irritate “team-transitory”, suggested that us over on team-transitory should be concerned that median CPI is at a 14 year high:


Unfortunately for Larry, median CPI is almost always the worst forecast for inflation until the 24 month point, at which it becomes the second worst!
With these tables, we can now answer our first question. Trimmed mean inflation is generally the best point estimate for future inflation, but more recently core inflation has also been worth looking at. But what about using consumer inflation expectations? How do they do? Well:
The Consumer Is Generally Wrong
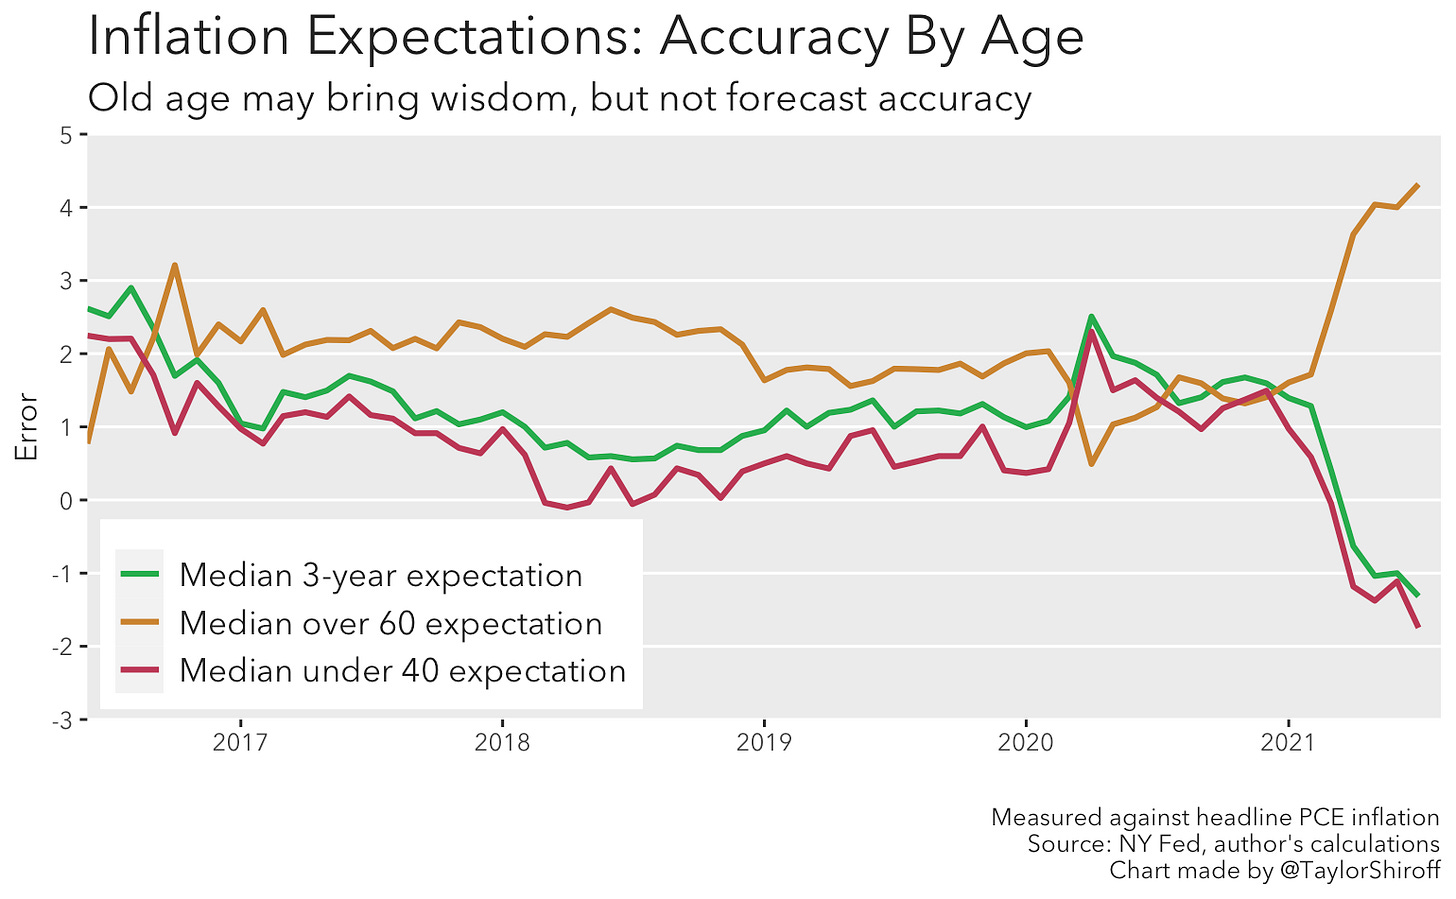
Consumer expectation surveys are often cited, but consumer expectations of inflation are not very accurate. The New York Fed’s consumer survey, updated last week, got a lot of attention as a result of its finding that consumers were now (at the median) expecting inflation in three years to be at 4%.
Fun fact about this dataset: it shows how bad consumers are at forecasting inflation. Interestingly, there is an accuracy gradient along the age axis: those under 40 are much more accurate than those over 60. Is this a reflection of having lived through the 1960s-early 1990s, where inflation was practically always above 2%? I’m not sure, but it’s clear: older survey recipients tend to have higher inflation expectations.
This is true as well at the 1 year horizon:
Naturally, this means that in the low-inflation era before the pandemic, those over 60 continuously expected inflation that was consistently above reality. Measuring accuracy by headline CPI inflation, this leads to noticeably larger errors at a three year horizon. The results look very similar when comparing accuracy with the CPI price index.
Consumers aren’t much better at forecasting one year into advance, either. However, this is true among all age differences.
In general, at both one and three year horizons, consumers expect inflation to be 1 percentage point higher than it actually is. At the three year horizon, those under 40 are pretty accurate, barring the pandemic (which could not have been visible 3 years in advance).
Currently, those under 40 expect inflation to be sitting at 3% in August 2024. Given the bias to over rather than underestimate inflation expectations, as well as all of the current inflation hype, I think this is a win for team transitory.
Conclusion
This post has been a lot—tables, charts, forecast terminology. The point is simply that trimmed mean inflation is first among equals with core inflation in forecasting future headline inflation. Headline inflation numbers are biased and volatile, so this should make sense. One place not to look for a good inflation forecast: consumer surveys. But if you do, listen to the younger respondents! They’ve been much more accurate over time.


