In Brief: Last Week's Data Releases
The recovery continues, but we're not there yet
Note: any and all opinions are entirely my own and do not necessarily reflect those of the Cleveland Fed, the FOMC, or any other person or entity within the Federal Reserve System. I am speaking exclusively for myself in this post (as well as in all other posts, comments, and other related materials). No content whatsoever should be seen to represent the views of the Federal Reserve System.
Quick note: sorry for the lack of posts in October! It’s been a crazy month between midterms and job interviews, but it’s not all been for nothing: I’m officially headed off to the Cleveland Fed as an RA starting next summer! I literally could not be any more excited and happy about it. Thank you, readers, for encouraging me (even if just by reading!) to keep up with this blog, as writing here has done so much good for me. You’ve all played some part, even if small, in getting me here, so thanks! Now it’s time for a quick post to get back into the swing of things:
This was one of those cool weeks where we get back-to-back GDP, PCE, and ECI data. I won’t dive into every corner of these reports, but I’ll run through some of the bits that I find interesting and useful. This will be a nice precursor to my next post, which revisit the early days of the pandemic to understand exactly how we got here.
Investment and consumption
Thursday’s GDP figures showed continued strong investment across all sectors (except transportation, where investment declined 4.5%). Investment is very close to the pre-pandemic trend, just below it.
Increased investment in R&D, intellectual property, and information technology (which includes computers) is largely driving the increases in headline investment. Transportation and investment in structures are the only two that are below their Q4 2019 levels.
Consumption in sectors hit particularly hard by the pandemic—specifically transportation, recreation, and food service—continued to see strong recoveries of demand. Food service consumption is back to trend and above its Q4 2019 level, while transportation and recreation are still below but recovering.
Inventories and imports
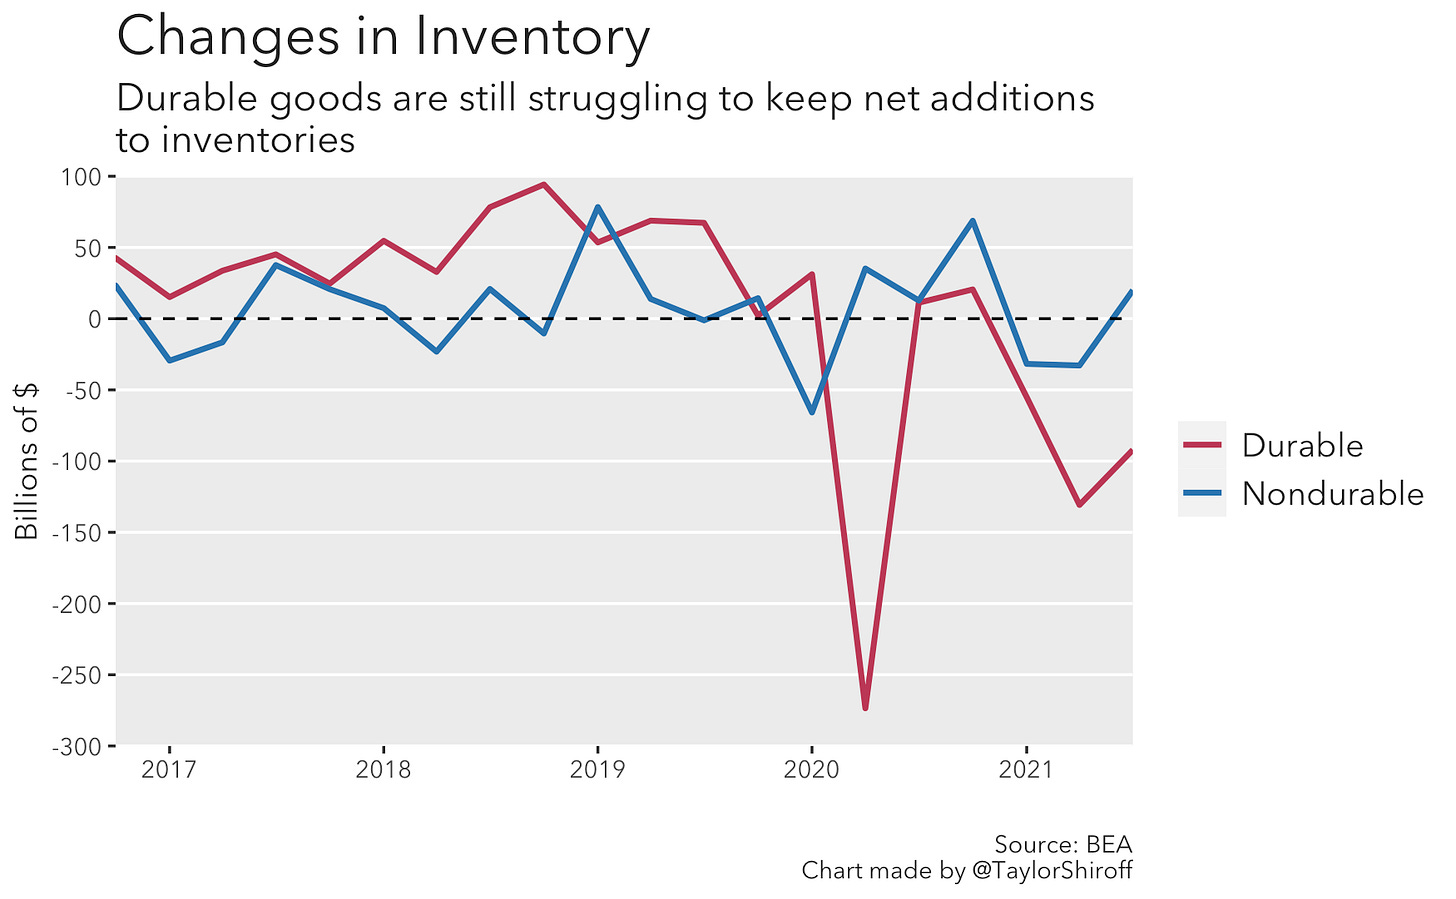
Durable goods are still leaving warehouses faster than new goods are coming in, but nondurable goods are back into net additions after two quarters of net declines:
There are a few reasons for the continued net declines in durable goods inventories. A partial list: Demand for durable goods has been strong since last summer, fueled in part by stimulus checks; imported durable goods have run into delayed delivery times due to congestion at several major ports (a side effect of increased demand); capacity constraints, some of which are due to resurgences of the pandemic, are limiting the ability for production to keep up with demand. This is in line with what we saw in September’s PMI releases: inventories are contracting, prices are increasing, order backlogs are piling up.
Speaking of imports, by quantity they hardly moved from Q2 to Q3. Their prices, though, continued to rise. This again mostly reflects the issues mentioned above.
Income and outlays
Personal income (and disposable income, but I’m setting aside taxes for now) actually fell in September, mostly due to the cutoff of pandemic-related government programs, specifically the enhanced unemployment benefits.
The decline in government transfers did help bring income closer to its pre-pandemic proportions:
These charts hit at the different stories of personal income with government transfers, and personal income without. The spikes in March/April 2020, January 2021, and March 2021 are the stimulus checks, but that leaves a sizable print of other programs, like the enhanced unemployment benefits. Before the pandemic, the difference was negligible; it’s slowly getting back to that point now.
A brief aside on wages
Much has been said about wage growth, too. While year-over-year wage growth looks enormous, the same is not seen on a monthly basis.
Further, aggregate wages are below where they likely would have been without the pandemic, as many remain unemployed or simply out of the labor force.
Saving and spending
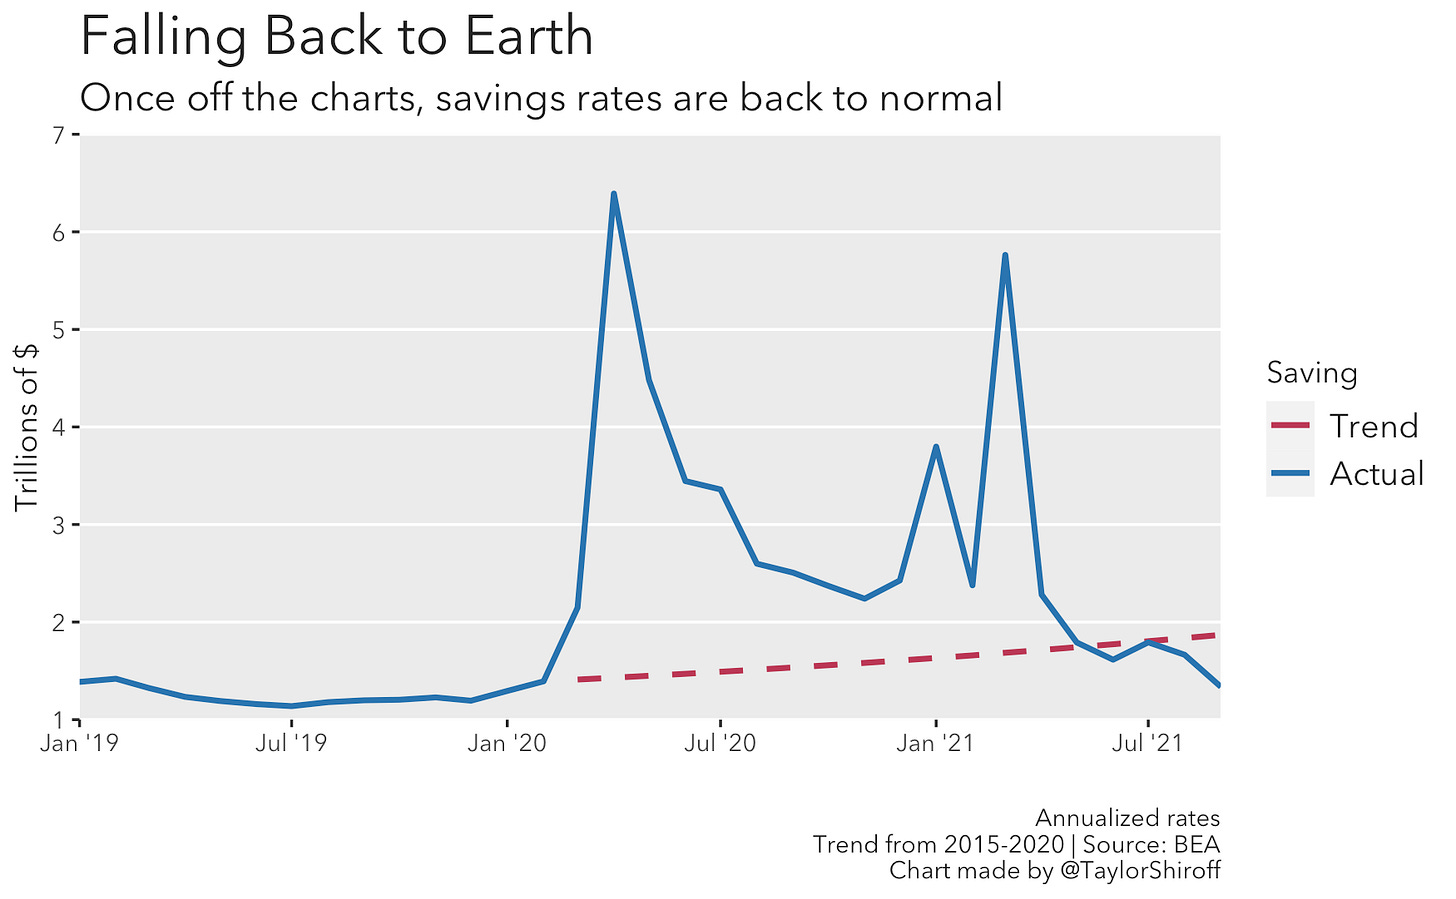
The combination of a partially-closed economy and government transfers meant people have been saving, and saving a lot. The saving rate declined to 7.5%, about half of what it was a year ago, and far below the 22.6% level hit in May of this year or the 33.8% mark hit in April 2020.
Note that personal saving is now below the trend line (from 2015 to 2020). The savings numbers are prone to revisions that can significantly alter the story they tell, but at least right now it looks like households are slowing down their saving. If we think of how much consumers saved above trend (that is, the area between the blue and red lines above) as “excess” savings as money that probably would not have been saved had there been no pandemic, we see that the stock of “excess” saving declined in September.
This is a byproduct of personal saving falling below trend. I interpret this as consumers feeling comfortable to save less than they normally would after having saved so much over the last year and a half. We can see that since March, consumers have been comfortable with the level of savings accumulated during the pandemic; excess savings stopped increasing.
We can tell a similar story in reverse about consumption. Consumers continued to make up for “lost’ consumption during the pandemic. By March, consumers had spent around $1.1 trillion less than they probably would’ve had there been no pandemic. March seems to really have been a turning point, and there are many good reasons why (vaccines, stimulus checks, reopening, etc).
A few obligatory words on inflation
Monthly inflation has continued to decline, especially in core PCE inflation, which ran at 0.21% in September. Without saying this looks good for “team-transitory” (kindly, I will think less of you if you try to argue with me over what that means), this doesn’t look great for team-”inflation will persist for a long while”. Don’t let incoming higher energy prices fool you into thinking the Fed (or fiscal policy) has created an inflation monster.
On a year over year basis, core PCE inflation has leveled out at around 3.5%. Headline PCE has continued to rise, largely due to rising energy prices (which are not a uniquely American problem!).
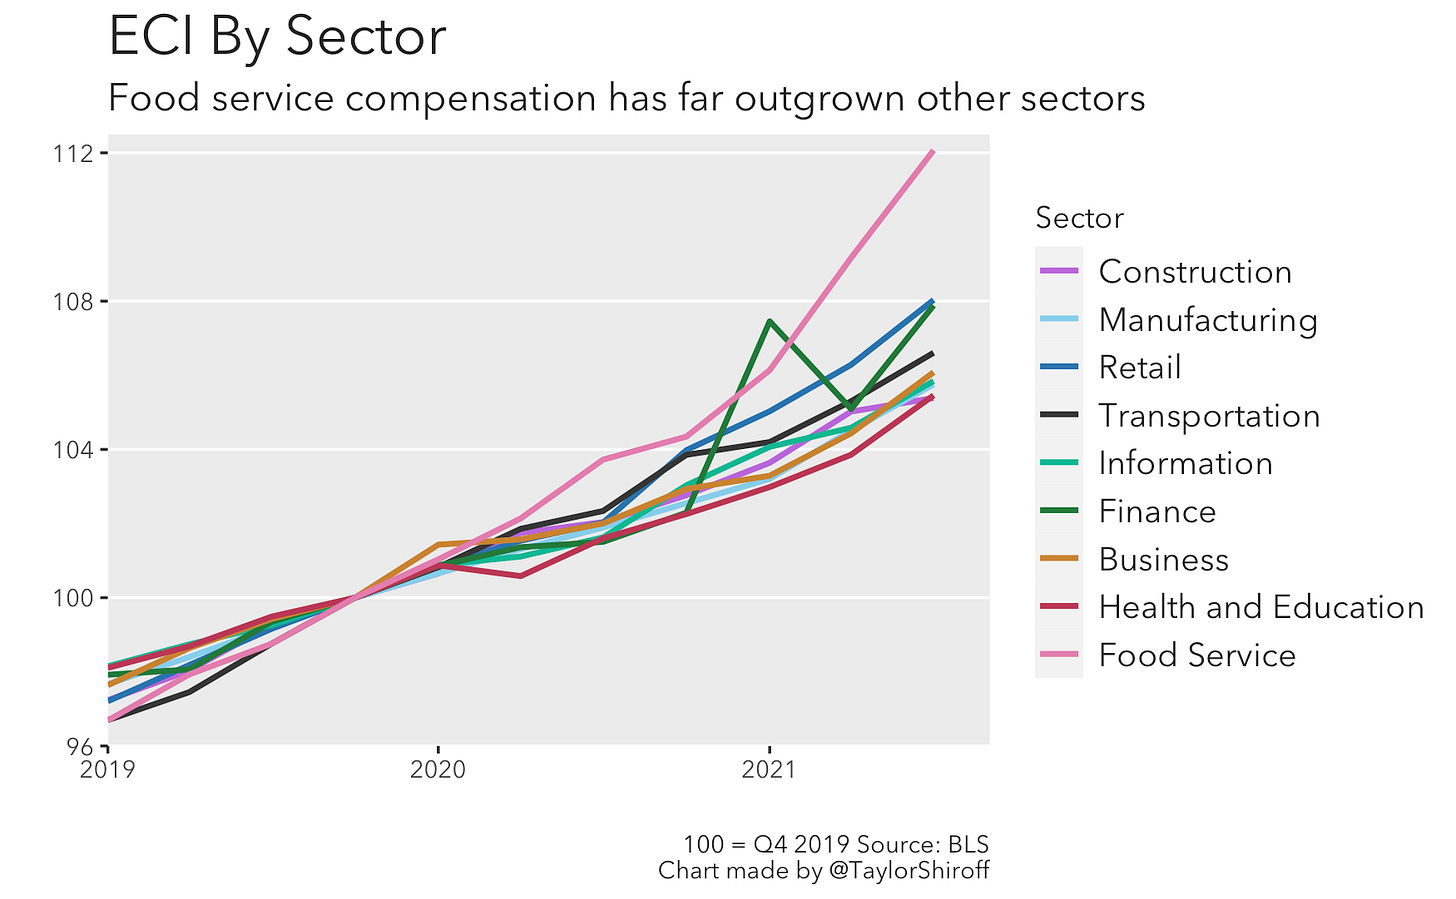
But without large and persistent gains in wages, this inflation simply cannot be permanent. How will households be able to keep up if real household income is falling? The ECI release this week showed a nice uptick in overall wages, but by sector the story isn’t uniform. Everyone’s heard about how wages in food services and accommodation have increased dramatically during the pandemic, but most other sectors more or less are back to their 2019 trend growth:
Conclusion
So there’s my run down of this week’s data releases. This data confirms to me that the recovery is still going strong. Supply chain issues caused by strong demand will keep inflation elevated, but wage growth has been strong (even if employment growth is slowing down) and businesses are continuing to invest, which will help solve supply chain issues and bring inflation down.


